If you are working with numbers, chances are you have encountered the concept of percentage deviation. But what is it exactly and how can you calculate it? In this post, we will explore the ins and outs of percentage deviation, from its definition to practical examples of how to calculate it.
Have you ever noticed that even a small deviation in data can lead to entirely different outcomes? This is where percentage deviation comes in. It is a useful tool for measuring the amount of variation or deviation in a set of data. Whether you are an economist, a scientist, or just working on a project that involves numbers, knowing how to calculate percentage deviation can help you to obtain more accurate results.
The formula for calculating percentage deviation is relatively simple. It involves finding the absolute difference between the observed value and the expected value, dividing that difference by the expected value, and multiplying the result by 100 to get a percentage. Mathematically, the formula looks like this:
To put it in simpler terms, the formula can be broken down into the following steps:
Step 1: Find the absolute difference
Find the absolute difference between the observed value and the expected value. The absolute difference is simply the positive difference between the two values, without taking into account whether one value is larger or smaller than the other.
Step 2: Divide the difference by the expected value
Divide the absolute difference by the expected value, and multiply the result by 100. This will give you the percentage deviation.
Example:
Suppose that you predicted that you would sell 100 units of a product, but you ended up selling only 80 units. What is the percentage deviation?
Solution:
Expected value = 100
Observed value = 80
Absolute difference = |100-80| = 20
Percentage deviation = (20/100) x 100 = 20%
When to use Percentage Deviation
Percentage deviation is useful in a wide range of settings, from measuring the accuracy of experimental data to predicting future trends. It is commonly used in fields such as physics, chemistry, economics, and finance to gauge the accuracy of predictions or to determine the variability of data. In essence, any situation that requires the comparison of two values can benefit from the use of percentage deviation.
The Pros and Cons of Percentage Deviation
Like any other tool, percentage deviation has its advantages and disadvantages. Its main advantage is that it provides a straightforward way to measure the amount of deviation or error in a set of data. It is also easy to interpret and can be expressed as a percentage, which allows for easy comparison between different sets of data. However, one of its main drawbacks is that it assumes a linear relationship between the variables, which may not always be the case. Additionally, percentage deviation does not take into account the direction of the deviation, which means that positive and negative deviations are treated as equal.
Applications of Percentage Deviation
Percentage deviation can be used in a variety of settings where numerical data is involved. Some of its applications include:
Quality Control:
Percentage deviation can be used to monitor the quality of manufactured products by comparing the actual measurements with the expected specifications.
Financial Analysis:
Percentage deviation can be used to analyze financial data, such as stock prices or interest rates, to predict trends and identify potential risks.
Scientific Research:
Percentage deviation can be used to determine the accuracy of experimental data and to compare the results with theoretical predictions.
Engineering:
Percentage deviation can be used to monitor the reliability of machinery and equipment by comparing the actual performance with the expected specifications.
Question and Answer
Q: Can percentage deviation be negative?
A: No, percentage deviation cannot be negative. It is always expressed as a positive number, even if the observed value is lower than the expected value.
Q: What is the difference between percentage deviation and percentage error?
A: Percentage deviation and percentage error are often used interchangeably, but they have slightly different meanings. Percentage error refers to the percentage difference between the actual value and the expected value, while percentage deviation refers to the percentage difference between the observed value and the expected value.
Q: How is percentage deviation used in statistical analysis?
A: Percentage deviation is commonly used in statistical analysis to measure the accuracy of predictions and to assess the variability of data.
Q: Can percentage deviation be greater than 100%?
A: Yes, percentage deviation can be greater than 100%. This occurs when the observed value is larger than the expected value.
Conclusion of How to Calculate Percentage Deviation
Percentage deviation is a simple yet powerful tool for measuring the amount of deviation or error in a set of data. By using this formula, you can calculate the percentage difference between two values and gain a better understanding of the accuracy and variability of your data. While it has its limitations, percentage deviation has a wide range of applications and can be useful in many different fields. By mastering the art of percentage deviation, you can ensure that your data analyses are accurate and reliable.
Gallery
Simple Statistics
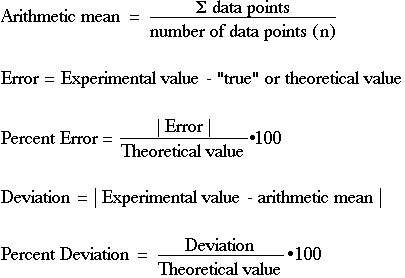
Photo Credit by: bing.com / deviation mean statistics sample calculator math simple shodor problem science stats
Simple Statistics
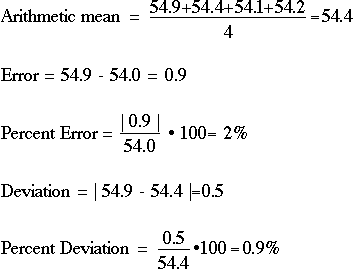
Photo Credit by: bing.com / deviation standard simple statistics example math calculator stats shodor data
How To Calculate The Standard Deviation | Standard Deviation, Standard

Photo Credit by: bing.com / statistics variance mathematics
Whatisscience / Analyzing The Results

Photo Credit by: bing.com / deviation percent average analyzing results number significant figures mean critical measurement any
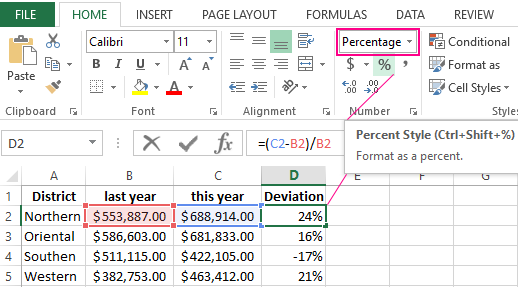
How To Calculate The Percentage Of Deviation In Excel
Photo Credit by: bing.com / percentage deviation calculate excel formulas calculating